Entering edit mode

9.3 years ago
ta_awwad
▴
350
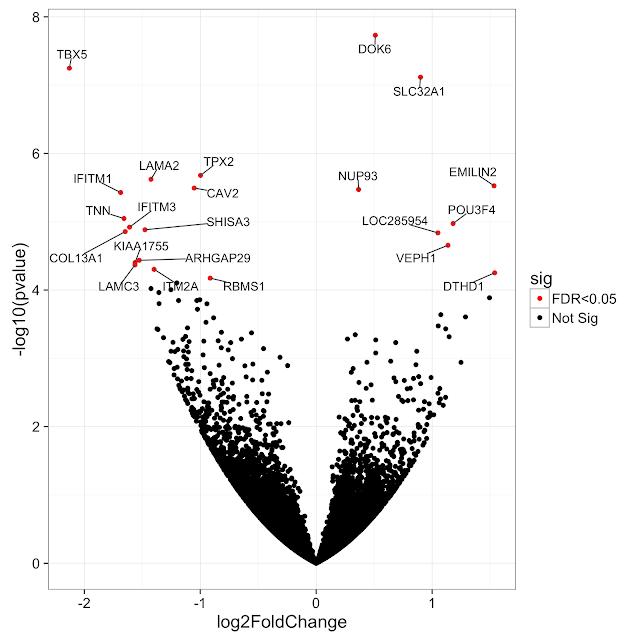
Hello everyone, I would like to have gene names added to volcano plot obtained from DEseq2 ... I have the following matrix:
                 baseMean log2FoldChange      lfcSE       stat        pvalue          padj
Aats-phe       1439.85510     -0.3915108 0.10641530  -3.679084  2.340731e-04  8.682721e-03
achi           1114.41542     -0.4206245 0.10794425  -3.896682  9.751936e-05  4.128319e-03
Act42A        25233.52971     -0.4144380 0.07727588  -5.363096  8.180730e-08  8.283542e-06
Ada             514.03083     -0.6321073 0.13696097  -4.615236  3.926483e-06  2.724179e-04
ade5           3620.63094      0.8756724 0.12531134   6.987974  2.788849e-12  5.804679e-10
Adgf-A         4432.04719     -0.3219797 0.08413694  -3.826854  1.297917e-04  5.173027e-03
alphaTub84B   22505.94872     -0.3424581 0.09110146  -3.759085  1.705361e-04  6.423805e-03
Ama             198.23454     -2.0373321 0.21461357  -9.493026  2.244235e-21  1.401338e-18
Ance           1513.97966     -0.3010685 0.09949477  -3.025973  2.478346e-03  4.876555e-02
as you see DEseq2 doesn't add an identifier to the gene name column (is there any option to do so?) .. and I used the following line to generate volcano plot:
with(subset(res, padj<.05 ), points(log2FoldChange, -log10(pvalue), pch=20, col="red", xlim=c(-10,10))).
now I would like to add gene names to the significantly DE genes.
thanks for your help


Can you append the output of
dput(res)so we can easily recreate the matrix?i would appreciate if you offer a script to do so. I am new in the field ,... that is why i don't want to make any miss