Design in DESeq: Can you combine explicit and implicit batch effect correction in (SVA+Metadata Variables)?
1
3
Entering edit mode
6.2 years ago

Hello,

I've heard of two different ways of doing batch effect correction:

1. Explicit:

design(myData_collapsed) <- ~ Sex + Genotype
dds <- DESeq(myData_collapsed)
deseqOutput <- results(dds, alpha = 0.05, contrasts = c('Genotype', 'A', 'B'))

2. Implicit:

# make a full model matrix
mod  <- model.matrix(~ Genotype, colData(myData_collapsed))
# make a null model to compare it to
mod0 <- model.matrix(~   1, colData(myData_collapsed))

# calculate SVs
svseq <- svaseq( assay(myData_collapsed), mod, mod0, n.sv = 4)
myData_collapsed$SV1 <- svseq$sv[,1]
myData_collapsed$SV2 <- svseq$sv[,2]
myData_collapsed$SV3 <- svseq$sv[,3]
myData_collapsed$SV4 <- svseq$sv[,4]

# redesign matrix
design(myData_collapsed) <- ~ SV1 + SV2 + SV3 + SV4 + Genotype

 # DESeq
dds <- DESeq(myData_collapsed)
deseqOutput <- results(dds, alpha = 0.05, contrasts = c('Genotype', 'A', 'B'))

I only ever see people doing one of the two strategies above. However, it seems to me that it should be possible to do both, just as long as you make sure to include the explicit batches in the design of your model matrix when calculating SVs, like so:

# make a full model matrix
mod  <- model.matrix(~ Sex + Genotype, colData(myData_collapsed))

# make a null model to compare it to
mod0 <- model.matrix(~   1, colData(myData_collapsed))

# make SVs
svseq <- svaseq( assay(myData_collapsed), mod, mod0, n.sv = 4)

# new DESeq matrix design
myData_collapsed$SV1 <- svseq$sv[,1]
myData_collapsed$SV2 <- svseq$sv[,2]
myData_collapsed$SV3 <- svseq$sv[,3]
myData_collapsed$SV4 <- svseq$sv[,4]
design(myData_collapsed) <- ~ SV1 + SV2 + SV3 + SV4 + Sex + Genotype

# perform DESeq
dds <- DESeq(myData_collapsed)
deseqOutput <- results(dds, alpha = 0.05, contrasts = c('Genotype', 'A', 'B'))

Is that correct?

(Or - just realized this - should the null model include the explicit batch effect, e.g. mod0 <- model.matrix(~ Sex, colData(myData_collapsed)) ?)

Thank you for your help! I appreciate all the help I've been getting from BioStars recently, and I hope I can do a good job at documentation for others Googling this issue.

SVA batch-effect DESeq2 R • 6.5k views
ADD COMMENT
2
Entering edit mode

I always go for the explicit when I have the confounding factors measured. Explicit model means you know the batch variables and where they are most likely from and solving the model will tell you how much they are each contributing. In hidden models, you just get a bunch of blobs which you need to dig out what they mean exactly by correlating with known factors.

ADD REPLY
0
Entering edit mode

I also have problems in detecting if the model I have is good as it is ~ sex + condition or if there is any batch in the data. What it makes me feel a bit confused is the % variance I am obtaining in the PCA plot. Could you help me?

Thanks

Both clusters are separated by gender but not condition but I cant image another variable to add in the design as I only want to compare between case/control population in an homogeneous population

ADD REPLY
0
Entering edit mode

Ciao teresa. I moved your question to a comment. In your PCA bi-plot, the percent variation on PC1 is relatively low (relative to the amount of variation expected with a batch effect, which could be up to 80%); however, the form of the 2 'strata' of samples looks too consistent for it to be based on just natural biological variation. You could try to colour the samples based on other metadata that you have in an attempt to identify a logical reason behind the finding.

ADD REPLY
0
Entering edit mode

Those two groups are separated by gender. When I colour the samples based on it the samples cluster perfectly into both groups: male and female. That's why I have used gender in the design. But I dont know if that is sufficient for the design. I have a question: adding another variable the % assigned would increase? In case that the design is ok with those two variables, would it be a problem presenting that PCA with so low variance in the results?

Thanks a lot Kevin.

ADD REPLY
0
Entering edit mode
ADD REPLY
4
Entering edit mode
6.2 years ago

The starting point to any RNA-seq experiment should be a well-designed study that negates the need for any form of batch adjustment / correction. This is often not the case, as we know.

In the 'explicit' part, you are not actually doing any adjustment for batch. You've just got gender (sex) and genotype in the design model - are you implying that gender is your 'batch' effect for which you are aiming to adjust? Gender can be a confounding factor in mixed-gender / transgender RNA-seq studies, in particular for genes transcribed from chromosome X and / or those that have escaped chrX inactivation.

In your 'implicit' part, with your code, you are looking for any residual batch (or other) effects in your data without knowing a priori what they may be. This type of adjustment should not be performed without good reason. Performing it without justification could lead to unnecessary adjustment of your coefficients and the obtaining of unrealistic P values during differential expression. It could be performed in a situation like this: our laboratory receives samples of minimal information and we are told to process them. We realise, after an initial test, that there are likely unknown batch effects, so, we employ SVA to model these effects and adjust for them (as you do).

-----------------------------------------------

batch effect known

When we know what is the batch effect, we should include it in the design formula, e.g.:

design = ~ batch + sex + genotype

This has the effect of modelling the known batch effect and making adjustments for it when it comes to differential expression analysis. No further adjustments from this are necessary unless you wish to use your normalised / transformed counts for other tools, downstream. In such a situation, there are 2 options:

batch effect(s) unknown

If the batch effect(s) is/are unknown, we can use SVA, as you have done, in which case we arrive at:

design = ~ SV1 + SV2 + Sex + Genotype

NB - include as minimal a number of surrogate variables in the model as possible; otherwise, you'll over-adjust

You can then later subtract out the modeled batch effect as above.


Yet other methods aim to directly adjust raw or normalised counts for either of the situations mentioned above. I go over this here in this previous answer: A: Batch effects : ComBat or removebatcheffects (limma package) ?

Kevin

ADD COMMENT
0
Entering edit mode

Thank you so much for your detailed answer! I'll address different parts of your post in unique comments to keep the threads separate.

Regarding Sex effects - good point. I referred to it colloquially as a "batch effect" but really what I mean was "factor I think we need to control for when calculating differentially expressed genes." Our study has both male and female samples in both Genotypes, but the Ns aren't even - one Genotype condition has more females. Based on existing literature, I don't think this genotypic aberration should affect sex-linked gene transcription at all. However, if I only do my study with the study design "~Genotype", the differential expression gene list has many X-linked genes - presumably due to the difference in the number of females in one group. Furthermore, when I cluster the rlog-normalized expression data, the samples cluster much better by Sex and less well by Genotype. This leads me to believe that the Sex effect is something that we'd need to 'correct' for in order to get to the real signal, which is how Genotype affects transcription. That's my rationale for including Sex as a "known batch effect."

ADD REPLY
0
Entering edit mode

Regarding when to use SVA - thanks, helpful to have an example for how it is deployed. I think I'm curious about the cases that fall into both categories. For example, in our data, I suspect there is a batch effect due to the cell thaw date, or that Sex is a factor to correct for (see other comment). However, even when I include those two factors in my study design, and observe how my data cluster in PCA after using the limma package's observeBatchEffects() function, my data do not cluster as cleanly as I would predict given my knowledge of the effect of this particular Genotype. Therefore, I thought there might be some other batch effect I might need to account for (e.g., I don't know, how long the sequencing core kept the library on the bench during preparation or something).

Once again - thank you so very much - starting a thorough read of the linked post.

ADD REPLY
0
Entering edit mode

Oh right, yeh, I see what you mean. There can be both known and unknown effects in the data. The known you can model in the design formula; the unknown can be estimated via things like SVA. The logic there is fine (to use both) but from experience I know that it's generally not a great idea to have a long design formula, i.e., it should be kept as short as possible so as to not 'over-adjust'. One then just relies on (or hopes!) that the experimental design is sufficient enough to control for everything.

I know that, from using SVA, the program returns some sort of estimate of how important is each identified surrogate variable. So, could you get away with just including 1 surrogate variable? Also, the justification for assuming that something like thaw date is having an influence would usually come from a PCA bi-plot - did you generate those and see samples segregating on thaw date?

One thing that I do in RNA-seq analyses is generate PCA bi-plots and colour the samples based on all variables given to me, including things like race, center, RIN, disease state, etc.

ADD REPLY
0
Entering edit mode

I'll see how it looks only using one SV - definitely don't want to overcorrect.

Previously, I've only plotted the first two PCs and colored by a factor (just as you said - did this by all factors given to me). I did see some clustering by thaw date as well as sex, though no clustering for the other variables. As a side note, if I perform SVA without including Sex/Thaw Date into my design matrix (example 2 above), I see that a couple of the SVs correlate pretty well with Sex and Thaw Date - so in example #2 it seems like some of that variance is being detected through SVs, even though I'm not explicitly including it in my design. That said - it's not like there is a single SV that perfectly corresponds with one of those factors - and I can't say whether or not having an SV account for a known batch effect is as effective as including it in the design.

I've never made a biplot before! I'll give it a try. In my first test just now, I see what looks like my usual PCA plot (where points = samples, colored by factor of interest), with a circle of arrows emanating from the center with each arrow representing a gene. As I understand it, the length of the arrow indicates the relative contribution of that gene to the plotted PCs, with short arrows having negligible effects on those PCs. Two follow up questions: 1. In the case of sequencing data, do you usually filter for some set of genes to plot fewer arrows/make the effects a little easier to see (since otherwise there is just a flurry of thousands of arrows)? 2. If a batch effect was present, in addition to sample clustering, would I expect to see a subset of genes pointing in the same direction?

ADD REPLY
0
Entering edit mode

Oh, which code were you using to generate the PCA bi-plots? DESeq2 has it's own built-in function, plotPCA(), and there's some of 'my' code here: A: PCA plot from read count matrix from RNA-Seq

Another critical thing to note is the amount of variance denoted on the axes.

For example, in a situation where there is a strong batch effect in a dataset, PC1 will separate the batches and it will account for >40% variation in the dataset. Less subtle effects may be encountered on higher (less important) PCs, and may only account for a negligible amount of variation. In such cases, there'd be more damage done in trying to adjust for these than not.

Of course, without seeing your data in front of me, it's difficult to give a clear yes / no in relation to how best to analyse it. These are usually judgement calls that are made independently for each study.

ADD REPLY
0
Entering edit mode

Ah I see!

I was using ggplot for my regular PCAs, and ggbiplots for my biplot:

library(ggbiplot)
g <- ggbiplot(cds.pca.rld_noBatchCorrect, obs.scale = 1, var.scale = 1, 
              groups = sampleTable$Genotype, ellipse = TRUE, 
              circle = TRUE,
              varname.size=0.2) # to functionally remove gene names from cluttering screen
g <- g + scale_color_discrete(name = '')
g <- g + theme(legend.direction = 'horizontal', 
               legend.position = 'top') 
print(g)

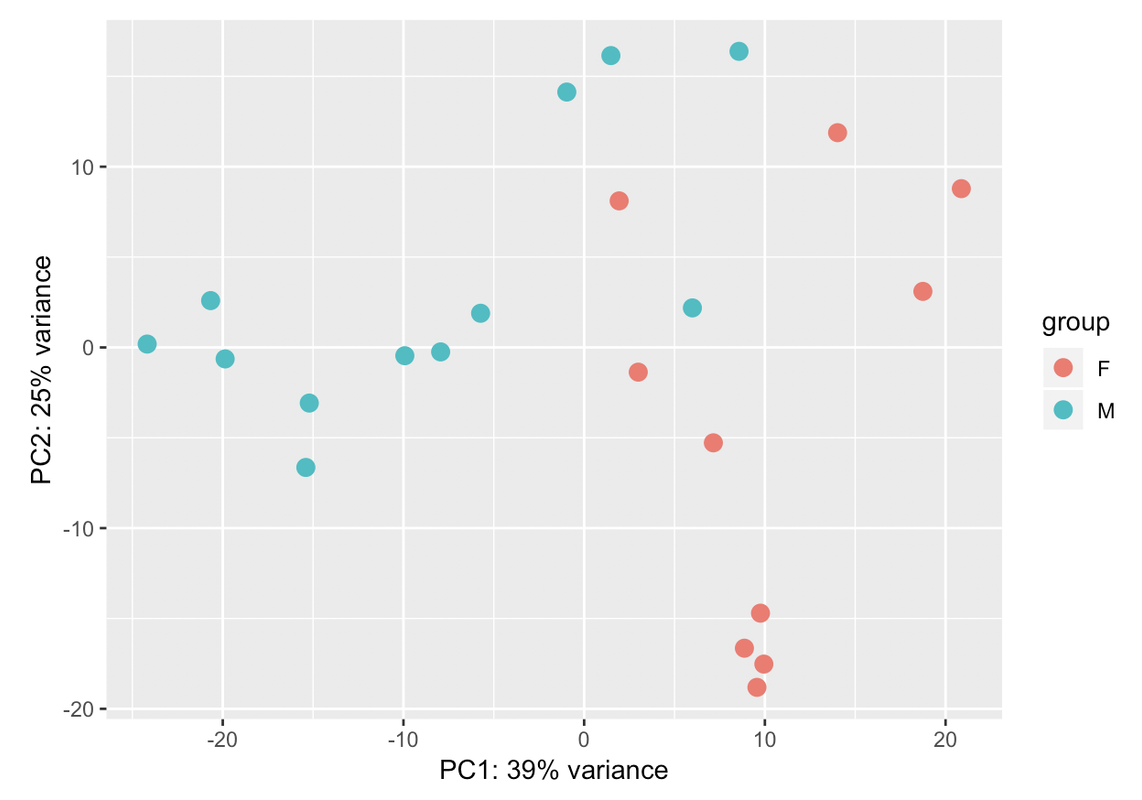
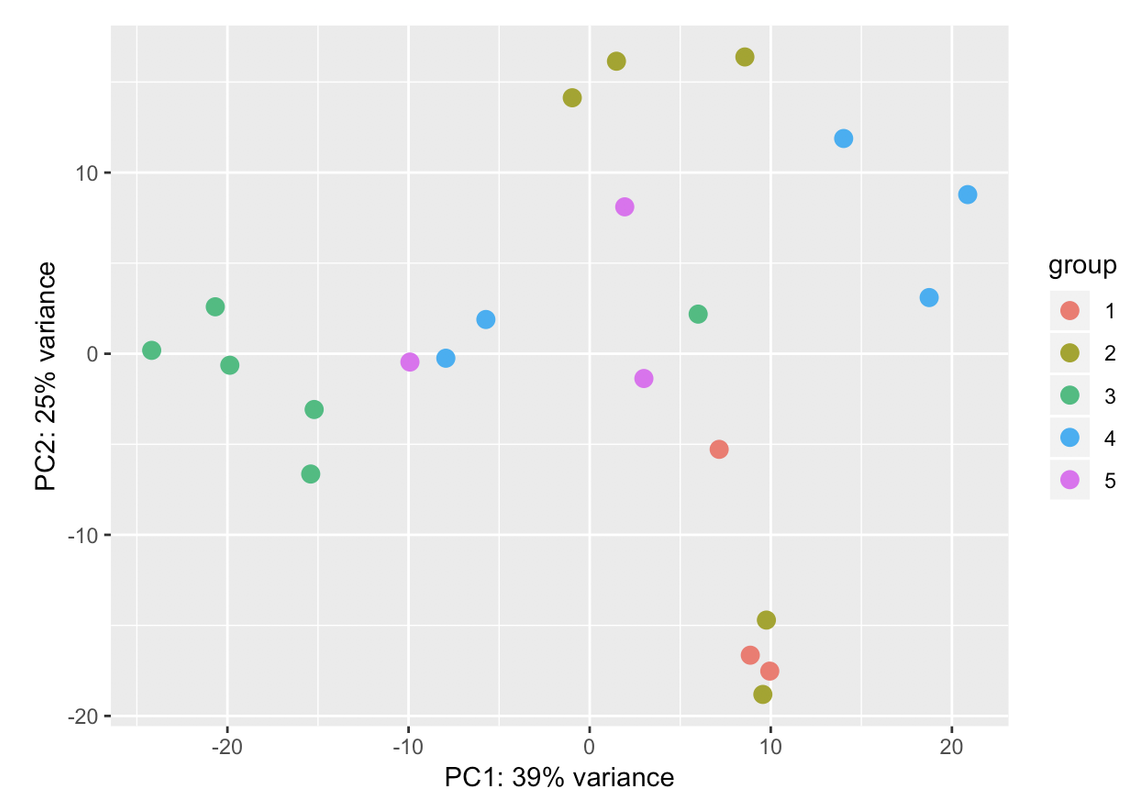
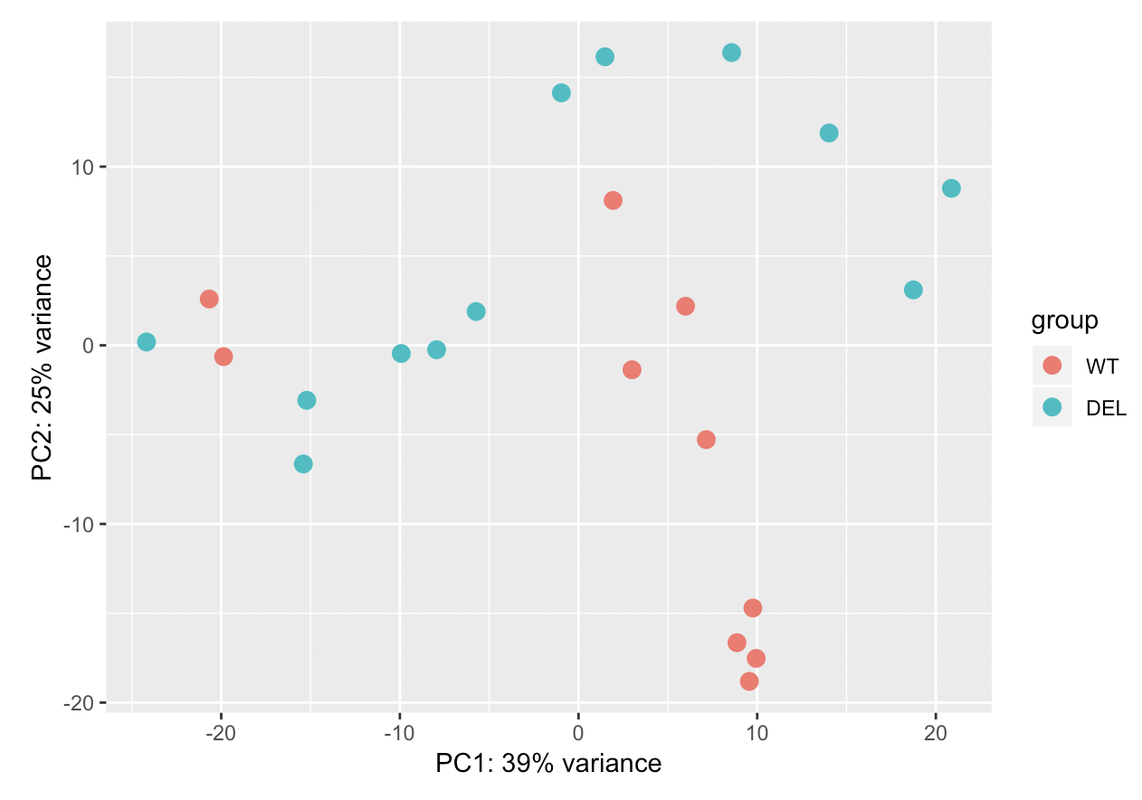
Using Plot PCA: PC1 accounts for 39% of the variance. PC2 accounts for 25% of the variance.

Color by Genotype: PCA by Genotype

Color by Sex: PCA by Sex

Color by Thaw Batch: enter image description here

I'd interpret these as there being a medium-high effect of Sex, and maybe a low-medium effect of GrowBatch, that might muddy clean clustering in Genotype. I would definitely consider including Sex in my results, but maybe not GrowBatch. Is that correct?

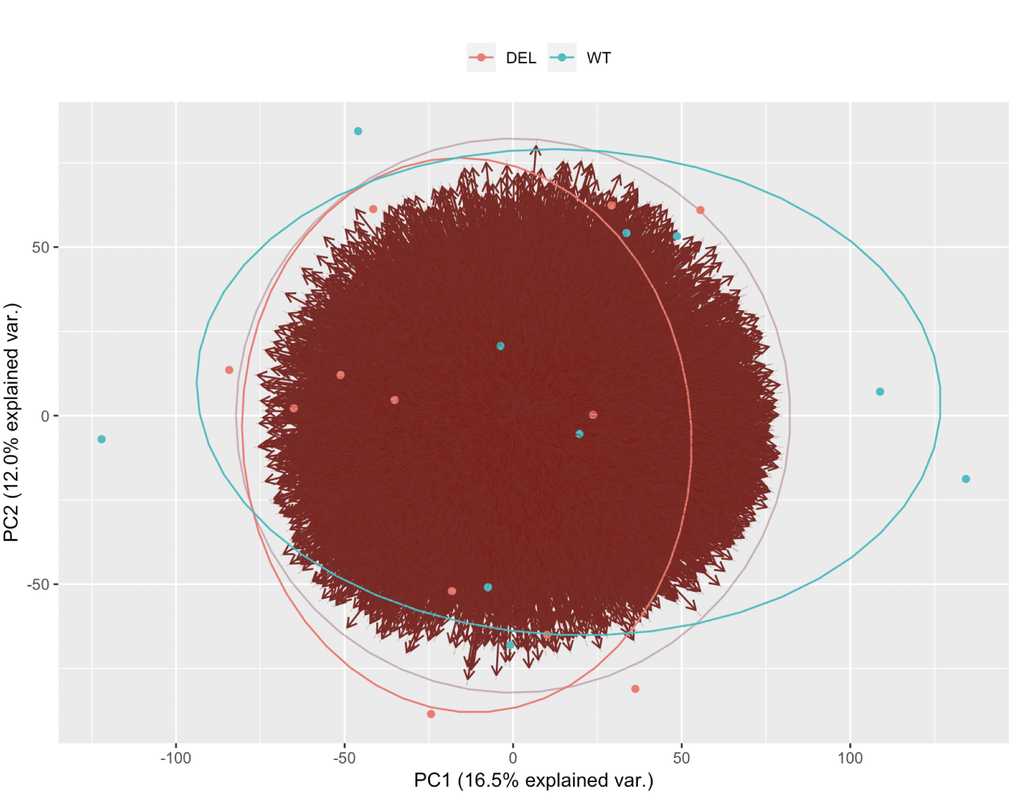
(Also, as a side note - the variance accounted for by each PC is different whether I'm using prcomp(), ggbiplot(), or plotPCA() - eek - I'll need to look into why that is. Genotype clusters much less well using prcomp() or ggbiplot() than it does here, and much less variance is explained. Pic below for ggbiplot() )

Genotype clustering using ggbiplot

ADD REPLY
0
Entering edit mode

Yes, looking at that, I would include sex in the design formula. Male:Female are almost exclusively segregated along the diagonal. Looking at Thaw Batch, it looks difficult including that in the design formula. Encouragingly, at least 1 sample from each Thaw Batch overlaps with those of another.

The reason for obtaining different variances by the different programs is because DESeq2's plotPCA() function's default is to filter out a large chunk of genes based on low variance before performing PCA. In this sense, it is biased / supervised PCA.

Other than everything else that I've written, your dataset looks good to go with ~ sex + genotype

ADD REPLY
0
Entering edit mode

Thank you very much!!

ADD REPLY
0
Entering edit mode

I have put the question below. Thanks in advanced !

ADD REPLY

Login before adding your answer.

Traffic: 813 users visited in the last hour
Help About
FAQ
Access RSS
API
Stats

Use of this site constitutes acceptance of our User Agreement and Privacy Policy.

Powered by the version 2.3.6