From A Sketch(Attached) Towards The Visualization Of Data-Sources
4
3
Entering edit mode
12.5 years ago
Lo Sauer ▴ 160

This is for an project which gathers data.

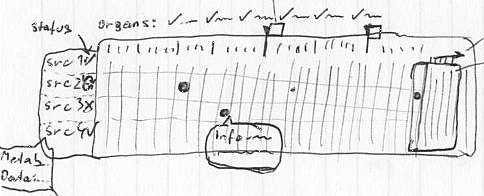
I am starting out with a sketch. The idea is to visualize heterogeneous data, which is requested from various data providers (src1...) upon a specific request (e.g. a molecule).

In a table / matrix I then visualize if the data is available and matches to a category on the X-axis. Upon clicking on one of these categories it slides open and reveals subcategories.

Which 'applet' do you know of, that comes closest to the sketch along with the description?

Have you seen something similar somewhere? Do you know of any good scripts?

Any input is appreciated...

Upd: Thanks. Some nice viz I have seen so far:

(resources) http://webapps.stackexchange.com/questions/8669/how-to-visualize-data-online

http://informatics.systemsbiology.net/visualizations/heatmap/bioheatmap.html based on http://code.google.com/apis/chart/

http://www.tableausoftware.com comprehensive, but dated (server-renders a new image and serves it to the client).

Sketch

database visualization webservice web • 4.6k views
ADD COMMENT
2
Entering edit mode
12.5 years ago

Your sketch reminds me of coMut visualizations from the Broad Institute:

http://www.broadinstitute.org/blog/visualizing-cancer-genome

alt text

I couldn't find a link to source code but it mentions the visualizations are done in R.

ADD COMMENT
0
Entering edit mode

nice, very nice.

ADD REPLY
1
Entering edit mode
12.5 years ago

The genome browsers at NCBI and UCSC perform similar functions, while not on tabularized but visual data. I do not know the applet behind their "inform" windows, but think that these are worth a look for your purposes.

ADD COMMENT
0
Entering edit mode

very good idea. a breeze of NCBI, EMBL inspiration :)

ADD REPLY
1
Entering edit mode
12.5 years ago

if you want to implement a JApplet, you should have a look a a tutorial about how to implement an AbstractTableModel:

here is an example of a table displaying the data of the UCSC RefGene: http://pastie.org/284507

See also how to implement a TableCellRenderer if you want to "draw" something in your table:

ADD COMMENT
0
Entering edit mode

Thanks, although I am leaning towards a pure HTML5 or SVG based solution.

ADD REPLY
1
Entering edit mode
12.5 years ago
Joachim ★ 2.9k

As others have said before, the Ensembl genome browser and the UCSC genome browser have similar displays. There is GBrowse too as well as JBrowse.

Lightweight web-toolkits for implementing such sites are jQuery and MooTools. Heavyweight toolkits are qooxdoo and ExtJS. The latter two toolkits offer extended support for dealing with tables dynamically as well as efficiently (when loading big data).

If you want to go beyond tables at some point, you might wanna have a look at d3.js, which is plain awesome.

I personally would not start working on a Java Applet anymore. The days of Java Applets are over and it seems that most web-development focuses on rich JavaScript libraries now. You can pretty much do more in less time simply by switching from Java development to JavaScript + toolkit development -- for web-development.

Joachim

ADD COMMENT
0
Entering edit mode

JApplet: I concur. d3.js is impressive! Do you by any chance know of a SBML or KGML loader or converter an HTML5 based network viz. Before d3.js I thought of using Raphael http://raphaeljs.com/.

ADD REPLY
0
Entering edit mode

Sorry, I cannot help you with an SBML/KGML loader. Perhaps someone else will pick up on that.

ADD REPLY

Login before adding your answer.

Traffic: 2553 users visited in the last hour
Help About
FAQ
Access RSS
API
Stats

Use of this site constitutes acceptance of our User Agreement and Privacy Policy.

Powered by the version 2.3.6