Entering edit mode

5.9 years ago
LuisNagano
▴
90
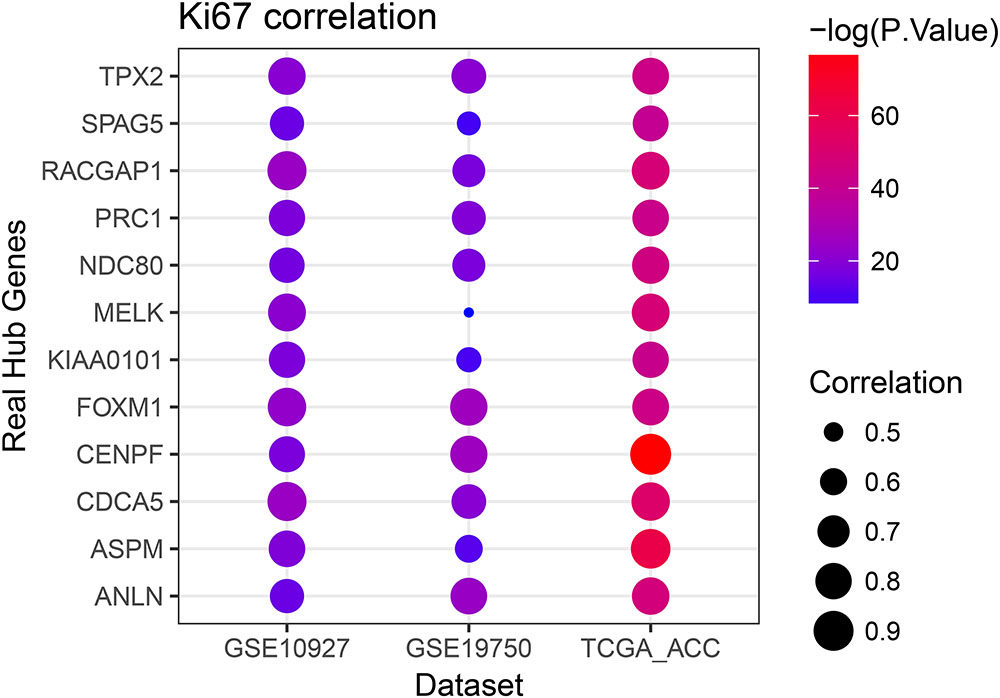
Which R package should I use to get a plot like this???
It's a Pearson's correlation analysis
Which R package should I use to get a plot like this???
It's a Pearson's correlation analysis

You can get such a plot with ggplot, using geom_point(aes(size = correlation, colour = logP)).
Indeed, use ggplot. Perhaps this will help: https://community.rstudio.com/t/scale-geom-point-size-to-increase-size-based-on-distance-from-zero/20244/2
Valeu, cara.
Use of this site constitutes acceptance of our User Agreement and Privacy Policy.
Try
corrplotI already use Corrplot, but it's not that specific package that I want