
Enrichments I am looking for a general approach / statistical test to claim statistical significance in enrichment plots as shown below, e.g. from ChIP- or ATAC-seq. Lets assume x-axis was a window around peak centers and y-axis was normalized clunts. I realize this has been discussed before (Chip-Seq Enrichment Profile Significance?) but the thread is quite old and does not fully cover /answer my question, so please see below:
Problems:
1) Would one use the summit read count (so at 0bp in the below plots) or rather a certain window around the center position? I guess it is difficult to define an exact center that is representative (especially if one has many samples/conditions) so a small window would probably make sense, but what about the size? I realize that there is no bullet-proof answer as it is dataset-dependent but please feel free to share your best practices.
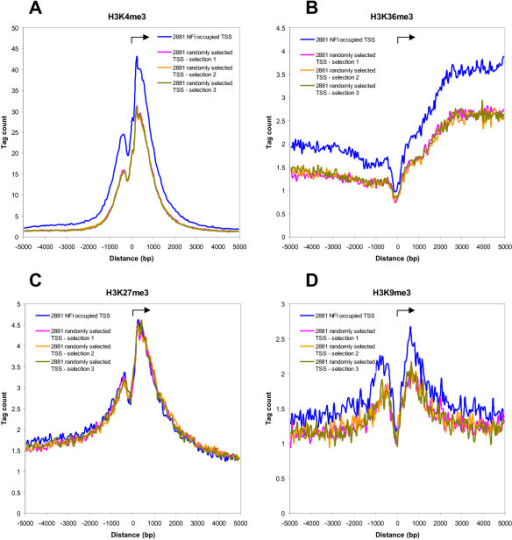
2) What if the peak is not "sharp" with one clear summit like for TFs but more complex, such as the ones one gets from H3K27ac or H3K9me3 (FigureD in below image) with a peak-valley-peak pattern or even broad marks such as H3K27me3. Would one define a window to to span the entire peak-valley-peak area followed by summarizing counts over this window?
3) Which test to use? Intuitively I guess a Wilcoxon test makes sense? Still, (correct me if wrong) from what I've seen this test easily produces very high significance when sample size is large, which is the case when dealing with counts from thousands of peaks. Is this concern justified? Is Wilcoxon appropriate or should one use something more tailored to large numbers of elements in the test?
4) Finally, say I perform multiple comparisons between different samples, would one need to correct for multiple testing here, even though we are dealing with low numbers of tests in comparison to e.g. DEG analysis where one performs thousands or tens-of-thousands of tests?
I would be interested in your best practices. Eventually I will have to incorporate / automate it into my R pipeline for ChIP-seq so advice on a general approach and suggestions of appropriate statistics would be preferred over tool suggestions. Still, any comments will be appreciated.


Thanks for the answer. I actually just took a random image from google for this post but the permutation-based strategy you mention is a promising suggestion to follow up on.