How can I get the ordered names or new matrix according to cluster result?
1
0
Entering edit mode
5.8 years ago
1106518271 ▴ 60

To cluster matirxmy, for this to see which colnames can divided into groups.

d <- dist(matirxmy, method = "euclidean") #dim(matixmy) 232, 121
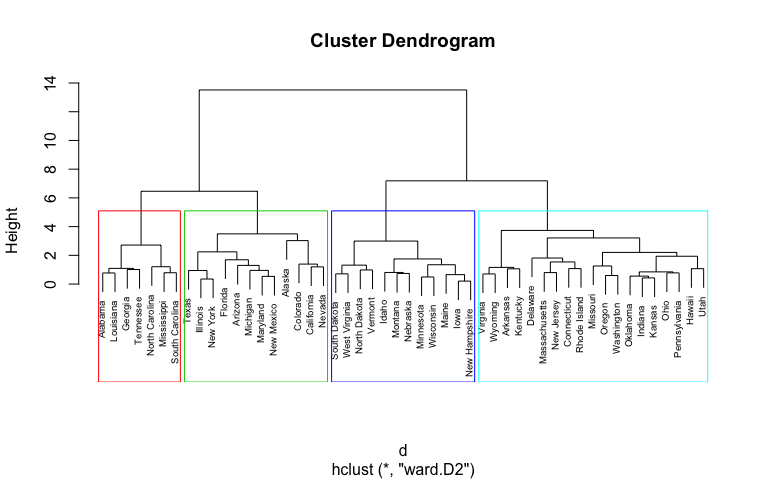
hc <- hclust(d)

Also, it can be plot like the first figureenter image description here
My question is for tree like figure shows, the accurate names from Left to Right (or R to L) can be showed on figure, but how can I get these names or this new sorted matrix based my cluster result to operate on server?
if I use

g <- cutree(hc, k=6) #4,5

Here can get 6 submatrix based on result of clusters. For me, I just know to extract submatrix by data[which(g==1), ]...data[which(g==6), ]. I tried let k=232,but not the expected result.

R next-gen • 1.6k views
ADD COMMENT
0
Entering edit mode

See: How to add images to a Biostars post - you'll need the image URL, not the google referrer URL with the search result page.

Here, the image URL is https://uc-r.github.io/public/images/analytics/clustering/hierarchical/unnamed-chunk-13-1.png

And you'll use the image option on the toolbar, not the external link option. Once done, it should look like this:

I've deliberately made the above image small so it is not usable. You can follow my lead (and my how-to post above) and make it any size you want to.

ADD REPLY
0
Entering edit mode

I see, very clear! Thanks!

ADD REPLY
6
Entering edit mode
5.8 years ago

To divide your original data based on the clustering, you can do this (here I generate random data):

data <- replicate(20, rnorm(50))
rownames(data) <- paste("Gene", c(1:nrow(data)))
colnames(data) <- paste("Sample", c(1:ncol(data)))

d <- dist(data, method = "euclidean") #dim(matixmy) 232, 121
hc <- hclust(d)

plot(hc)

Screen_Shot_2018_07_12_at_20_16_03

g <- cutree(hc, k=6) 

names(g[which(g==1)])
 [1] "Gene 1"  "Gene 2"  "Gene 7"  "Gene 8"  "Gene 9"  "Gene 10" "Gene 16"
 [8] "Gene 18" "Gene 20" "Gene 24" "Gene 27" "Gene 34" "Gene 35" "Gene 36"
[15] "Gene 39" "Gene 43" "Gene 44" "Gene 46" "Gene 48" "Gene 50"

data.clus1 <- data[names(g[which(g==1)]),]
data.clus1[,1:5]
             Sample 1     Sample 2     Sample 3    Sample 4    Sample 5
Gene 1  -0.3265533798 -0.353788700 -1.252597406  1.02673012  0.78063500
Gene 2   0.3894123896  1.287610679  0.510763521 -0.41776115 -0.07522766
Gene 7  -0.3502039599 -0.054720953 -0.866460675 -1.53013823  0.88244826
Gene 8   0.5703786887 -0.730078360  0.073504515 -0.16464475 -0.43750484
Gene 9   0.0009042849  0.160435234 -0.729832035 -1.82075100  1.23383174
Gene 10  0.8403966124  1.047750927  0.592436038 -0.43713363 -0.70182272
Gene 16 -1.2432953888 -1.071980681  0.465425922  2.07541867 -2.14403843
Gene 18 -0.0446571980  0.329836350 -0.439705377 -2.18505552  0.25679223
Gene 20 -2.0107250315 -0.085088554  0.142902875 -1.11932036 -1.20391413
Gene 24  0.0035652976  0.313601613 -0.007974485  0.78838515 -0.26814648
Gene 27  1.0571817267 -1.525753500 -1.298142377 -0.14882204 -0.18546145
Gene 34 -1.2390634629  2.065688036 -0.503428684 -0.47974532 -0.10128702
Gene 35 -0.9853974196 -1.614916506 -1.995684116 -1.26023029  0.35043024
Gene 36 -1.8284639443 -0.333458263 -0.435001541 -0.89361539  0.72974594
Gene 39 -0.5316389059 -0.006727708  0.997842431  0.22530868  0.91806786
Gene 43 -0.9923273610 -0.407900015 -1.617834400  0.65051190 -0.46099219
Gene 44 -0.3936848429 -0.522017104 -0.512397019 -0.26706115 -0.53908429
Gene 46  0.6143568276 -0.057919155 -1.407929426  0.08260024 -2.37762996
Gene 48 -0.5401317577  1.445300993 -0.034920714  0.10447368  1.05554193
Gene 50  0.7484196524  0.270700166 -0.859674703  0.21166880  1.43766975

data.clus2 <- data[names(g[which(g==2)]),]
data.clus2[,1:5]
          Sample 1    Sample 2   Sample 3   Sample 4   Sample 5
Gene 3   0.2202918  0.05289355 -0.7730082 -1.0181504 -1.4074479
Gene 25 -1.0449318 -1.17589940 -0.3072553 -1.5618628  0.8176866
Gene 26  1.1615993  0.20727857 -2.9046389  0.4583936 -0.1916534
Gene 31  0.3505871  0.75520916  0.1726550 -0.5983129  0.1327144
Gene 45 -2.2247328 -0.23420779 -1.0515205 -0.8389772 -1.3951449

data.clus3 <- data[names(g[which(g==3)]),]
data.clus4 <- data[names(g[which(g==4)]),]
data.clus5 <- data[names(g[which(g==5)]),]
data.clus6 <- data[names(g[which(g==6)]),]

Kevin

ADD COMMENT
0
Entering edit mode

I wonder can I get gene names or matirx sorted as: #like cluster dendrogram shows from Left to Right:

Gene 31
Gene 45
Gene 26
Gene 3
Gene 25
Gene 33
...
Gene 50
Gene 46
Gene 35
Gene 36

ADD REPLY
1
Entering edit mode

Yes, of course, to get it sorted as per the dendrogram (left-to-right), you can use this:

# check:
rownames(data)[hc$order]

# re-order data-frame:
data[hc$order,]
ADD REPLY
0
Entering edit mode

I seeked this command a long time, thanks!

ADD REPLY
1
Entering edit mode

Yes, I know the feeling. A useful tip for these things: You can see the structure of a R object with the str command. So, if you run str(hc), you can see all information stored in the hc object, one of which is the order from left-to-right of the dendrogram.

ADD REPLY
1
Entering edit mode

I see, so kind of you, truly inspirational!

ADD REPLY

Login before adding your answer.

Traffic: 2627 users visited in the last hour
Help About
FAQ
Access RSS
API
Stats

Use of this site constitutes acceptance of our User Agreement and Privacy Policy.

Powered by the version 2.3.6