Statistical test for replicates
3
0
Entering edit mode
5.8 years ago
JC • 0

Dear all,

I have some libraries with its replicates. To know how similar are they (between replicates) I made a Venn diagram of unique sequences showing this results:

Worse

Having that I wondered if removing those sequences with one read would improve the diagram. The result of doing that is the following:
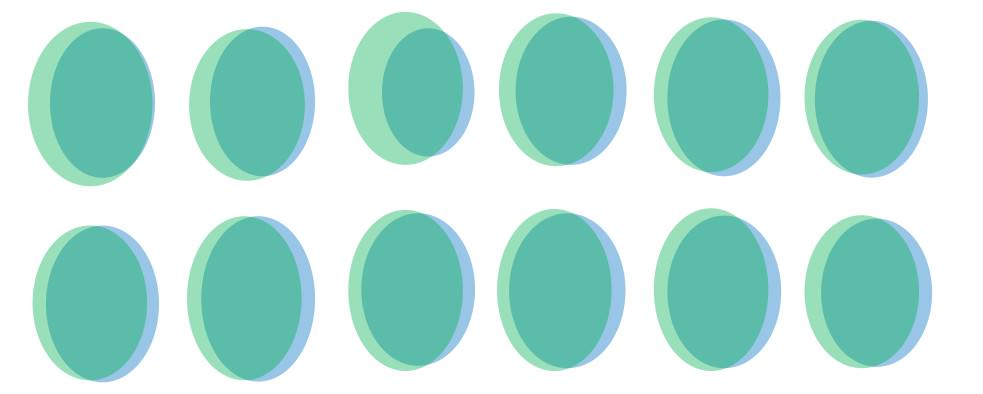
Better

Now I would like to know if there is enough similitude between both replicates. There is a statistical test that I could apply to know this? If not there is some method that I could apply to know if I should remove more sequences with more reads o leave it as it was before?

Thank you everyone

Edit: The libraries come from a smallRNA-seq and I mapped the reads against the genome before doing the Venn diagrams.

RNA-Seq • 1.7k views
ADD COMMENT
0
Entering edit mode

Please see How to add images to a Biostars post and follow the guide to add images properly.

ADD REPLY
0
Entering edit mode

What exactly do you want to test, i.e. what is the question of interest here and what do the different pairs represent?

ADD REPLY
3
Entering edit mode
5.8 years ago
Michele Busby ★ 2.2k

When you sequence small RNA you often get reads that are the degradation products of longer mRNA. These might be what you are seeing. It will be better or worse depending on the protocol. If it is just a size selection there will be a lot of junk. If you are looking for miRNA there is an enzyme that preferentially pulls out the phosphorylated (?) cap on the 5' (?) end of the molecule.

To test if the libraries are good do a scatter plot of the replicates against one another using the count of each small RNA in log space. i.e. point j is at the log of the count of reads mapping to small RNA j in replicate 1 against the log of the count of small RNA j in replicate 2.

If the counts are similar between the libraries you are good to go. If they are the technical reps it should be almost a straight line with some spread near the bottom. If they are biological reps it should look more dispersed.

ADD COMMENT
1
Entering edit mode
5.8 years ago

Making Venn diagrams of unique sequences is not going to be useful, just delete those and continue on with the actual analysis (e.g., mapping or assembling the files).

ADD COMMENT
0
Entering edit mode

Hello Ryan,

I already map them (before doing the Venn diagram). But I would like to confirm that the aligned reads are reliable.

Thank you for your answer.

ADD REPLY
0
Entering edit mode

If you want to ensure that the alignments are reliable then filter by a reasonable MAPQ.

ADD REPLY
0
Entering edit mode

Hello,

Then is fine to trust in reads that only appear once in all the library of smallRNA-seq?

ADD REPLY
0
Entering edit mode

The reads are what they are, don't try to fight with a little sequencer noise. If a particular transcript only gets 1 count in one sample it'll just get ignored anyway.

ADD REPLY
0
Entering edit mode

Good job on the images, OP! I saw you trying a bunch of solutions and at last hit the right solution!

ADD REPLY
0
Entering edit mode

Sorry for not doing it before Ram and thank you for your advice.

ADD REPLY
0
Entering edit mode

No problem, JC. Thanks for putting in the effort!

ADD REPLY
1
Entering edit mode
5.8 years ago
Benn 8.3k

A better approach to see if replicates are similar, is to quantify your reads per small RNA (with e.g., featureCount). Then calculate the pairwise correlation between all your samples. The technical replicates would correlate best with each other and would indicate that your experiment went well (technically).

ADD COMMENT

Login before adding your answer.

Traffic: 2740 users visited in the last hour
Help About
FAQ
Access RSS
API
Stats

Use of this site constitutes acceptance of our User Agreement and Privacy Policy.

Powered by the version 2.3.6