First of all, I should say you should either consider paying for full access, or look for an unrestricted tool that does what you want - it will be a much better option than processing low quality images.
As this seemed like a fun little project for a Friday evening, I tried to extract the information from the image you linked. First I had to find an R package to manipulate and extract information from the image, some googling took me to The magick package: Advanced Image-Processing in R. It has several examples, so it was perfect to get started.
So on to reading the image, which involved:
- reading the image into R
- cropping the image to keep only the heatmap
There was some trial and error involved in getting only the heatmap portion of the figure, but it was pretty quick. This is the code:
library(magick)
Genevestigator <- image_read( "Screen_Shot_2018-07-31_at_6.46.11_PM.png" )
print( Genevestigator )
gv.heatmap <- image_crop(Genevestigator, geometry_area(500, 500, 360, 220), repage = FALSE)
gv.heatmap <- image_trim(gv.heatmap)
print( gv.heatmap )
image_info( Genevestigator )
gv.heatmap.buf <- as.integer( gv.heatmap[[1]] )
dim( gv.heatmap.buf )
The resulting object is an array of sRGB values - it can be visualized as a matrix of RGB values, each cell of the matrix corresponding to one pixel. Examining the top of the array, it is possible to see a "square" of identical RGB values from lines 7-15 and columns 5-14, all with the values R=208, G=144, B=144.
I extracted just one column of values, choosing column 9 as it should be good to infer the first column of colours from the heatmap.
fc.rows <- gv.heatmap.buf[ 1:326, 9, 1:3 ]
fc.rows <- data.frame( fc.rows )
Now, with a small block of code so ugly I am embarrassed to post it here (but I will, nonetheless, otherwise there is no answer), I inferred the RGB values referring to the first vertical column of squares. The logic is simple and naive, but worked fine for the image you linked: find blocks of lines with at least four identical lines, this should correspond to the colour of the heatmap squares.
The code is simple (and ugly): initialize the variable holding the current RGB value to a value outside RGB specs, loop over each row of the RGB values, testing for three equal lines in a row. As the count() function from the plyr package returns the frequencies of equal lines, I use this value to infer when there are three identical lines - when this happens for the first time for each block of identical values, the RGB values are entered into the filteredRGB variable. The first if / else block guarantees just one RGB value per block is filtered, and changes currentRGB when it is different from the current RGB value.
library(plyr)
library(data.table)

filteredRGB <- NULL
currentRGB <- c(256,256,256)
for ( i in 1:nrow( fc.rows ) ){
  if ( sum( currentRGB == fc.rows[i,] ) == 3 ){
    next
  } else {
    currentRGB <- fc.rows[i,]
  }
  if ( count( data.frame( fc.rows[i:(i+2),] ), vars = c("X1", "X2", "X3") )$freq == 3 ){
    currentRGB <- fc.rows[i,]
    filteredRGB <- rbind( filteredRGB, currentRGB )
  }
}
Now plot the values to check if extraction worked:
colours <- rgb( filteredRGB[,1:3] / 255 )
plot(1:23,rep(1,23), col = colours, pch = 16, cex = 3 )

Yay, it seems it worked! Ok, I extracted just the first column of values, but it shouldn't be hard to extend the code to extract all columns. One idea would be to modify the code above to get "good" index columns for RGB value extraction for each column of the heatmap (midpoint position for each block of identical values in a row), then loop over these indices to extract the values for each row.


Can you not use an alternate tool? Messing with the bitmaps of a million squares is bound to lead to some headaches, if easily feasible.
Genevestigator is the only tool that can produce this image/data.
No, it is not the only tool... not by any means. Look at my own function, here: CorLevelPlot - Visualise correlation results, e.g., clinical parameter correlations
That looks like some kind of a heatmap. If you are able to export a matrix of values from Genvestigator then you should be able to plot an image like that in R (How to plot a heatmap with two different distance matrices for X and Y or Heatmap based with FPKM values ). Legends on at top and left can be made to look as you have them along with colors you need.
I really just need a way to decipher this heat map and put it in number form to show correlation between genes. I can do it by hand in an excel document but I was wondering if there is a faster way.
If by that you mean you don't actually have/can't export the matrix that was used for the generation of this figure, then we can't do much.
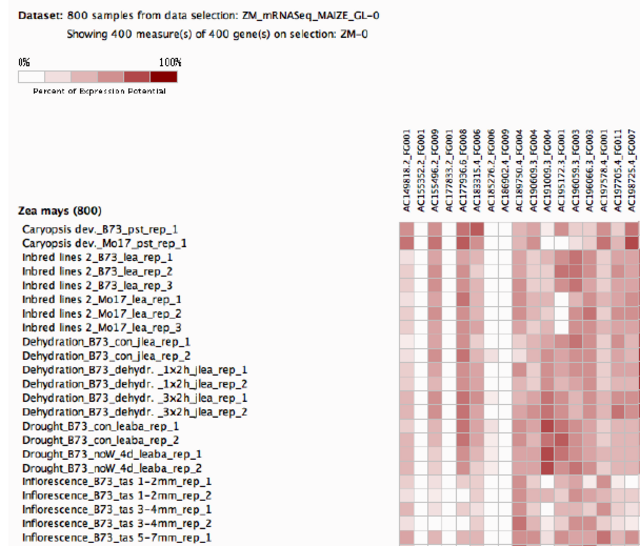
![400 genes x 800 conditions][1]
Thank you for the effort but I realized that the image from the original question is not big enough. Can this code be used for this a much larger amount of data?
You are welcome.
Yes, with a little tweaking the code can be used with your new image, because the image is of sufficient quality.
bweil2 : Don't forget to follow up on your threads.
If an answer was helpful, you should upvote it; if the answer resolved your question, you should mark it as accepted. You can accept more than one if they work.
