After doing GO-term enrichment or similar analysis, one ends up with a list of GO terms with associated data (e.g. p-value). In order to visualize this data, I have tried simply plotting the resulting induced graph, using R and Bioconductor, but the result is just a big tangled mess. Is there any better way to view the graph structure of my results?
Just heard of this new tool REViGO - Reduce + Visualize Gene Ontology : . Very effective in summarizing and visualizing GO terms using P-value from enrichment or other analysis. Offers a variety of visualization options to visualize GO terms. You can visualize your results in scatterplot, cytoscape based graph layout, treemap etc.
Hello, I'm the author of REVIGO - it looks like it might fit your purpose. Note that REVIGO's visualizations are based on the GO terms' semantic similarity, and do not necessarily reflect the parent-child relationships in the GO graph. REVIGO can also shorten long lists of GO terms by removing redundant terms, therefore making interpretation easier.
I had tried Reivogo recently, I was not able to customize the node or edge variables after taking into cytoscape. Have you guys experienced anything like this?
I'm assuming that you are able to export the graph as some kind of portable format.
The R igraph library is quite good. However, it can take some time to discover the best parameters for creating plots that look good and are not crowded. It also suffers from the more general R problem - very slow plotting for very large datasets.
You could also take a look at Cytoscape - again, there is something of a learning curve to discover the best parameters and speed issues for big data, but it is geared toward biological networks.
I've had good results using Gephi. The latest version is still in alpha, but reasonably stable. It will import common graph formats including GraphML and GML.
Beyond visualizing the graph structure (I've used CytoScape), I'm wondering if your GO enrichment analysis has shown a lot of GO terms; if so...
I've adopted a procedure to reduce the complexity of the induced DAG, based on a subsequent filtering of over-represented GO terms.
First of all I have collected a semantic similarity score for each couple of GO term which belong to the same sub-ontology (BP, CC or MF). An R package for obtaining these data would be GOSemSim
Next step is to consider all scores as a dissimilarity matrix with which you could perform a kind of cluster analisys (for my work I've chosen a PAM clustering).
The filtering step consists of taking into account only GO terms which belong to clusters characterized by a good silhouette score.
By this way you have obtained not only a set of over-represented terms originated from your gene set, but you also have subsetted those terms which are closely related each other. It would be a further refinement for selecting the most important terms which could better describe your gene set, doesn't it?!
If you're not committed to a particular GO enrichment algorithm, check out the Cytoscape plug-in BiNGO (http://www.psb.ugent.be/cbd/papers/BiNGO, Maere Bioinformatics 2005). The big win for BiNGO that directly gets at your question is that for each analysis, you get 1) the list of significant terms with which genes contribute to that term's significance, and 2) a Cytoscape network of the subset of GO circumscribed by the significant gene ontology terms from your search. Each term is size and color-coded, so that larger nodes have more genes and darker nodes are more significantly enriched. Intermediate terms that aren't significant are present as small white nodes. I find this is very helpful for discovering which terms are children of each other, which are actually too general to be useful, etc.
You can use your own custom annotations, although this is slightly painful as you have to replace files inside of the bingo.jar file rather than referencing an external annotation file. Your gene list can either be pasted in from the clipboard, or if you have an existing network in Cytoscape you can use the selected node names as input.
Use REViGO to reduce the list of GO terms.
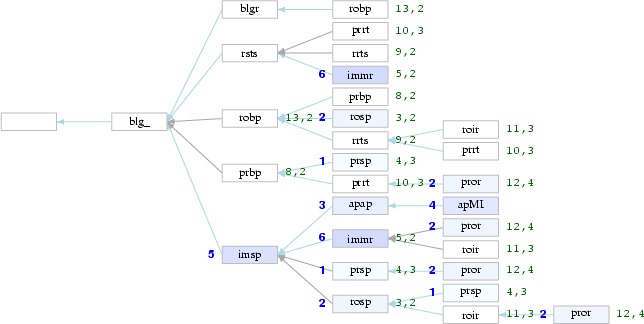
To visualize the graph structure (DAG) with significant GO terms usegetAmigoTree function from RamiGO Bioconductor package .


+1 for REViGO, excellent tool
Is REViGO still the best way today ?
Hello, I'm the author of REVIGO - it looks like it might fit your purpose. Note that REVIGO's visualizations are based on the GO terms' semantic similarity, and do not necessarily reflect the parent-child relationships in the GO graph. REVIGO can also shorten long lists of GO terms by removing redundant terms, therefore making interpretation easier.
Is there a tool like REVIGO that can be applied to other gene sets (i.e. not GO terms)?
Welcome to BioStar Fran !
I had tried Reivogo recently, I was not able to customize the node or edge variables after taking into cytoscape. Have you guys experienced anything like this?