Entering edit mode

10.1 years ago
Na Sed
▴
310
I was seeking the pathway analysis of a gene list and just saw two contrast things which made me too confused.
In https://support.bioconductor.org/p/54827/ the guys discuss enrichment analysis and "Paul Shannon" has suggested the below code to calculate p-values.
library(KEGGREST)
library(org.Hs.eg.db)

# created named list, eg:  path:map00010: "Glycolysis / Gluconeogenesis"

pathways.list <- keggList("pathway", "hsa")

# make them into KEGG-style human pathway identifiers
pathway.codes <- sub("path:", "", names(pathways.list))

# for demonstration, just use the first ten pathways
# not all pathways exist for human, so TODO: tryCatch the
# keggGet to be robust against those failures

# subsetting by c(TRUE, FALSE) -- which repeats
# as many times as needed, sorts through some
# unexpected packaging of geneIDs in the GENE element
# of each pw[[n]]

# genes.by.pathway <- sapply(pathway.codes,
#                            function(pwid){
#                              pw <- keggGet(pwid)
#                              pw[[1]]$GENE[c(TRUE, FALSE)]
#                            })
load(paste(Data_path, "KEGG_Gene_Pathways.RData"))

all.geneIDs <- keys(org.Hs.eg.db)

# chose one of these for demonstration.  the first (a whole genome random
# set of 100 genes)  has very little enrichment, the second, a random set
# from the pathways themsevles,  has very good enrichment

genes.of.interest <- c("23118", "23119", "23304", "25998", "26001", "51043",
                       "55632", "55643", "55743", "55870", "7314",  "56254",
                       "7316",  "144193","784",   "8837",  "1111",  "84706",
                       "200931","169522","5707",  "5091",  "5901",  "55532",
                       "9777")# the hypergeometric distribution is traditionally explained in terms of

# drawing a sample of balls from an urn containing black and white balls.
# to keep the arguments straight (in my mind at least), I use these terms
# here also

pVals.by.pathway <- sapply(names(genes.by.pathway),
                           function(pathway) {
                             pathway.genes <- genes.by.pathway[[pathway]]
                             white.balls.drawn <- length(intersect(genes.of.interest, pathway.genes))
                             white.balls.in.urn <- length(pathway.genes)
                             total.balls.in.urn <- length(all.geneIDs)
                             black.balls.in.urn <- total.balls.in.urn - white.balls.in.urn
                             total.balls.drawn.from.urn <- length(genes.of.interest)
                             dhyper(white.balls.drawn,
                                    white.balls.in.urn,
                                    black.balls.in.urn,
                                    total.balls.drawn.from.urn)
                           })

print(pVals.by.pathway)
As you know, dhyper returns
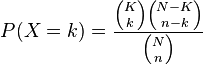
On the other side, http://www.tongji.edu.cn/~qiliu/help/help_3_ORA.html provides a complete definition of pathway over-representation analysis, and says the p-value is calculated as

Actually, my problem is not about the summation over 'x', but it is about the subtraction of the formula from '1'.
Which of them is true? Does anyone know about it?
