Hi @reui879
You can achieve something similar to the image you linked with the Bioconductor packages karyoploteR and CopyNumberPlots.
The data you provide is too minimal to create a meaningful plot, so I'll start by creating a more realistic looking sample data. To do that, we'll take advantage of the createRandomRegions function from the package regioneR. We'll first create the segmentation of the genome and assign random copy numbers to it and then create the "data points" based on these copy numbers.
library(regioneR)
library(karyoploteR)
library(CopyNumberPlots)
hg19 <- filterChromosomes(getGenome("hg19"), organism = "hg", chr.type = "canonical")
rr <- regioneR::createRandomRegions(nregions = 15, length.mean = 40e6, length.sd = 30e6, genome=hg19, mask=NA, non.overlapping = TRUE)
rr <- sort(c(rr, subtractRegions(hg19, rr)))
rr$cn <- sample(size = length(rr), x = c(0,rep(1,2), rep(2,10), rep(3,3), rep(4,2)), replace = TRUE)
tiles <- unlist(tileGenome(setNames(end(hg19), seqnames(hg19)), tilewidth = 2e6))
tiles$lrr <- rnorm(length(tiles), mean = 2, sd = 0.3)
for(i in 1:length(tiles)) {
tiles$lrr[i] <- tiles$lrr[i] + subsetByOverlaps(rr, tiles[i])$cn - 2
}
And now we can start plotting. We'll create first a karyoplot with the function plotKaryotype (setting the plot.type to 4 to get all chromosomes in a single line). Since the data points are equivalent to the LRR signal in a SNP-array, we can use the plotLRR function from CopyNumberPlots (or we could directly use kpPoints and customize it). Finally, to plot the copy number lines we'll use the function PlotCopyNumberCallsAsLines from the CopyNumberPlots package.
kp <- plotKaryotype("hg19", plot.type = 4, main="Random Data, 2Mb resolution", cex=2)
plotLRR(kp, tiles, ymin=0, ymax=5, add.axis = FALSE, labels=NA)
plotCopyNumberCallsAsLines(kp, cn.calls = rr, ymin=0, ymax=5, labels="ploidy")
With these three lines of code we'd get an image like this
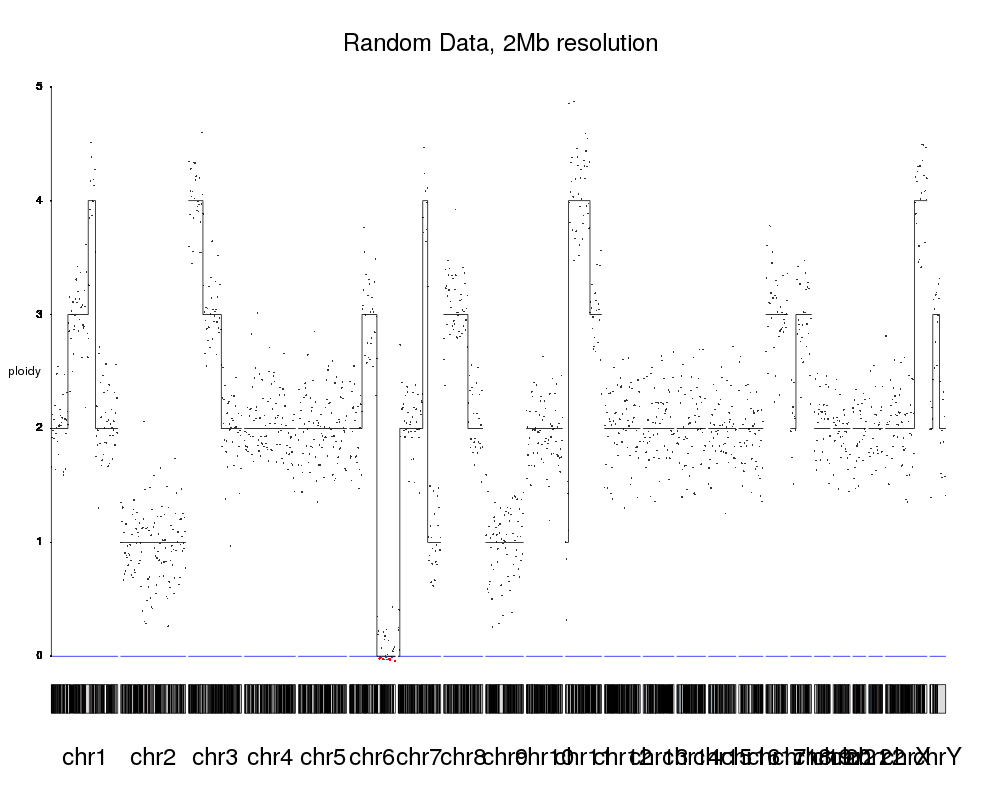
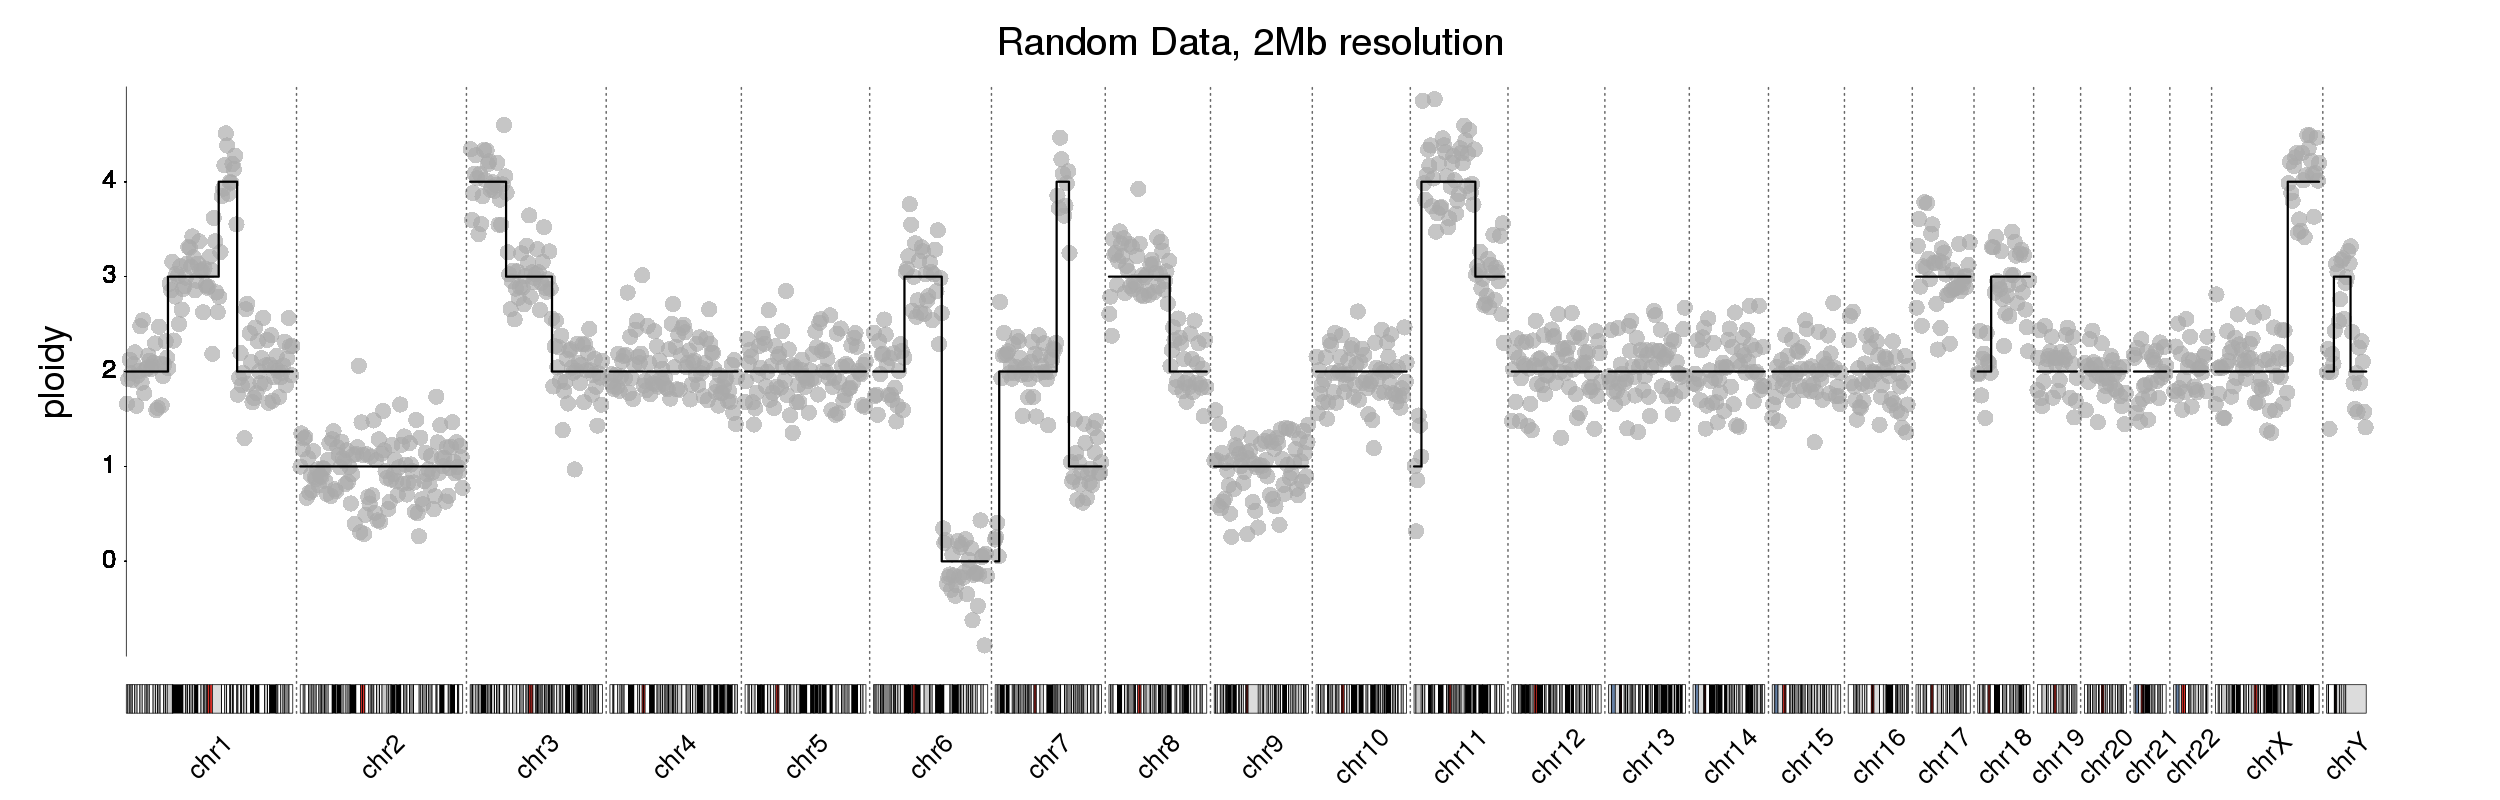
With this as a starting point, we can adjust a few parameters, add chromosome separators, an improved axis and labels and the image will end up looking much more like the one you linked.
kp <- plotKaryotype("hg19", plot.type = 4, labels.plotter = NULL, main="Random Data, 2Mb resolution", cex=3.2)
kpAddChromosomeNames(kp, srt=45, cex=2.2)
plotLRR(kp, tiles, ymin=-1, ymax=5, labels = NA,  points.col = "#AAAAAAAA", line.at.0 = FALSE, points.cex = 3, add.axis = FALSE)
plotCopyNumberCallsAsLines(kp, cn.calls = rr, ymin=-1, ymax=5, lwd=3, add.axis=FALSE, labels = NA)
kpAddChromosomeSeparators(kp, lwd=2, col = "#666666")
kpAxis(kp, ymin = -1, ymax=5, tick.pos = 0:4, cex=2.2)
kpAddLabels(kp, labels = "ploidy", cex=3, srt=90, pos=3, label.margin = 0.025)
There's more information on how to use the karyoploteR in the tutorial page and you can find more information on CopyNumberPlotsin the package vignette.
Hope this helps


Thank you! When I plot
with my own data I get this error
Error: subscript contains invalid names