Inconsistent numbers when using Kegg pathway analysis via DAVID?
2
2
Entering edit mode
8.9 years ago
alnchalker ▴ 20

Hi all,

Sorry for what may be a very elementary question. I've been using DAVID to analyze a bunch of Uniprot IDs, with what appears to be a decent amount of success. However, I've encountered an ... inconsistency in my readouts that confuses me.

My list contains 14 IDs, all of which seem to have been read without problems by the DAVID list manager. When I go to my annotation summary results, it says that 10 of 14 showed some sort of pathway relevance. Okay, cool, that makes sense.

But when I click, I see that 7 of 14 factors were not included in the analysis? And when I go through the pathways individually, I see that that's correct -- 7 appear, and 7 do not. So what happened to the other 3? Where does the 10 come from?

I'm very new to this type of analysis, and could use a little advice from the more experienced. Thank you!

kegg DAVID • 4.6k views
ADD COMMENT
1
Entering edit mode
Be careful with DAVID, it's knowledge base hasn't been updated in years. Maybe that's part of the problem. See Is the DAVID knowledgebase not updated any more?
ADD REPLY
3
Entering edit mode
7.7 years ago
EagleEye 7.5k

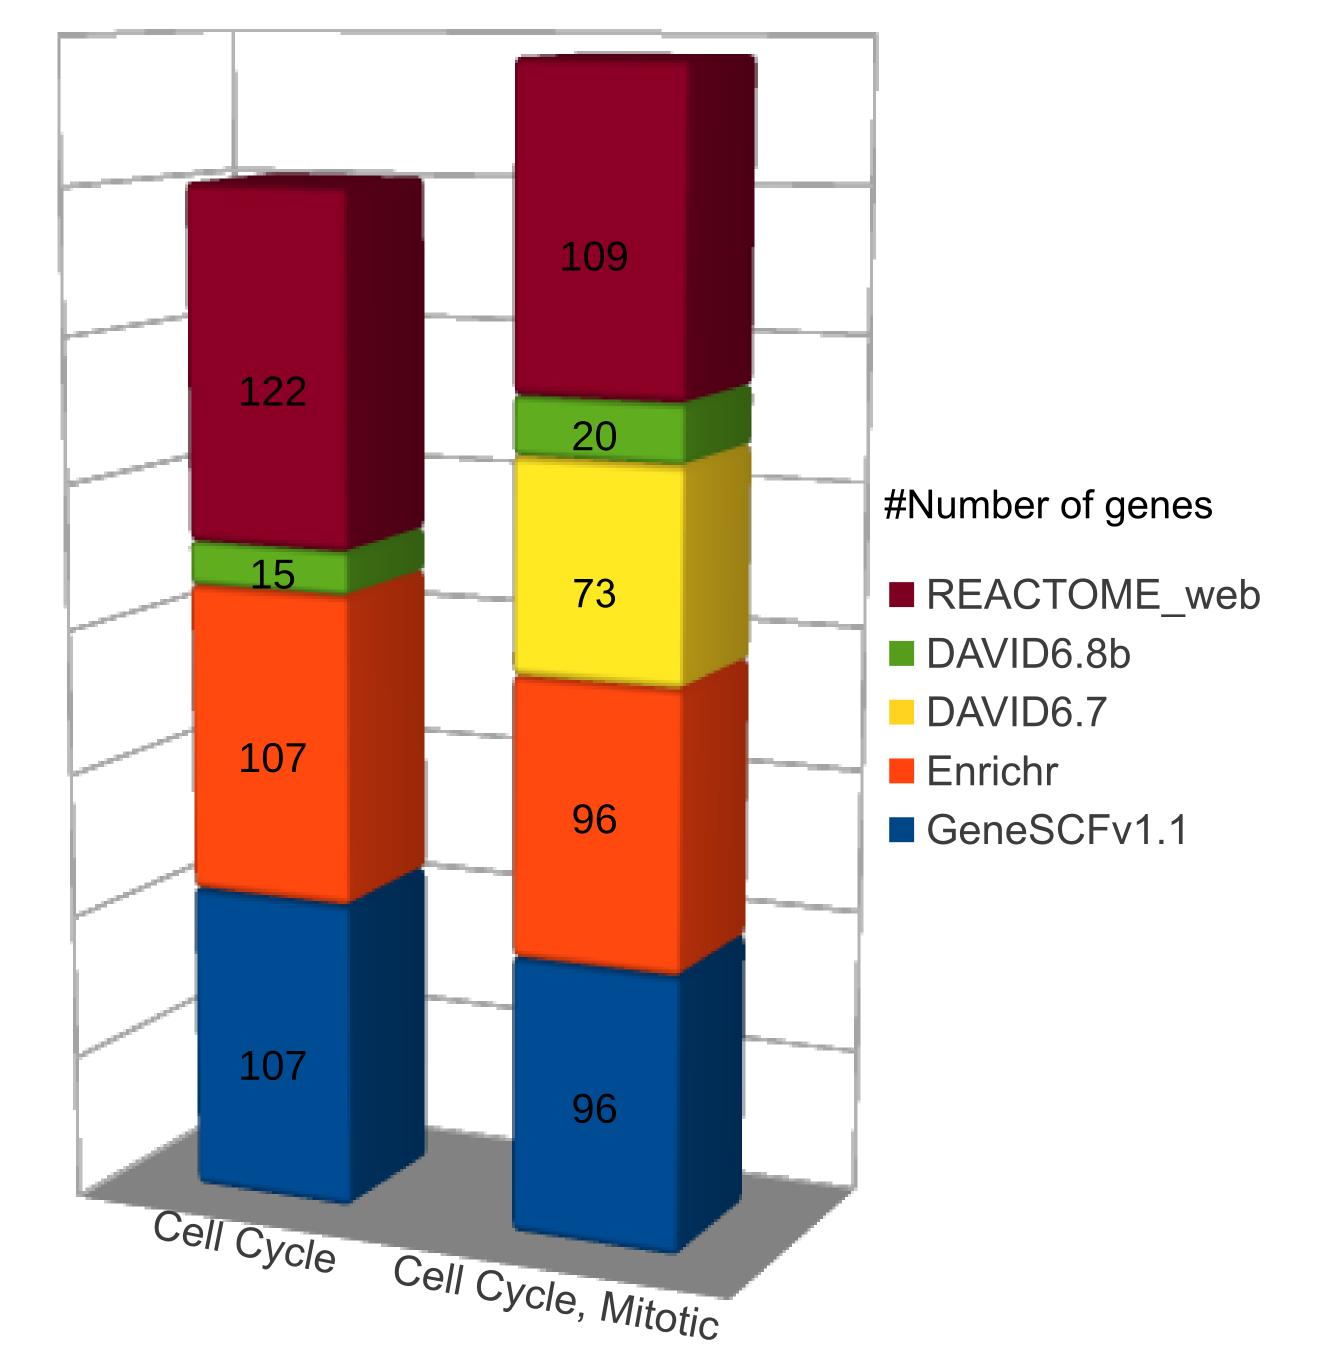
I can see lot of posts about DAVID got updated recently, therefore I tried to compare DAVID 6.7, DAVID 6.8-beta, GeneSCFv1.1, Enrichr and REACTOME web tool for Reactome pathways.

I can find consistency in detecting number of genes with GeneSCF, Enrichr and REACTOME web tool. But DAVID gives strange results with both the versions. I thought since DAVID 6.8 beta has recently updated, it should give more accurate and updated results.

For comparison purpose I used these Cell Cycle related genes inaddition with some random genes as input to all these tools. GeneSCF_run_log

Please your suggestions are welcome, if I missed some information on DAVID update.

Here are the results..

enter image description here

More post on Biostars about GeneSCF,

Gene Set Clustering based on Functional annotation (GeneSCF)

ADD COMMENT
0
Entering edit mode

Hi EagleEye, Which software you are using to make this Figure? excel?

ADD REPLY
0
Entering edit mode

This figure is simple barplot from MATLAB . To be specific 'bar' function :-)

ADD REPLY
0
Entering edit mode

Darn! We thought DAVID came back healthy from a long hibernation.

ADD REPLY
0
Entering edit mode

It seems like NOT an healthy update.

ADD REPLY
0
Entering edit mode
7.7 years ago

Hi,

  Please, I am new here and not a great bioinformatician. In DAVID tools, I have runned a list of 1500 genes in the morning and it gave a GO list of genes and in the pathway analysis it shoed Kegg, BIOCARTA and Panther...afterwards, the same list runned in the afternoon, it gave a different list of GO terms and in the pathway analysis the PANTHER list is no longer there. This has happened more than once. Would this be a result of peak time of DAVDI tool use? COuld anyone comment? T
   Thank you.
ADD COMMENT
0
Entering edit mode

If you are not familiar with command line too, try using Enrichr web tool which gives similar results compared to GeneSCFv1.1 for pathway analysis. But still the Gene Ontology and KEGG has to be compared.

Advantages of GeneSCF.

ADD REPLY

Login before adding your answer.

Traffic: 1684 users visited in the last hour
Help About
FAQ
Access RSS
API
Stats

Use of this site constitutes acceptance of our User Agreement and Privacy Policy.

Powered by the version 2.3.6